The Most Overlooked Fleet Metric: Stops Per Driver Hour
You're tracking fuel costs. Idle time is on the dashboard. You've got data on cost per mile, vehicle utilisation, maintenance schedules — the whole lot.
And yet your fleet operations still feel like they're leaving something on the table.
Here's the question worth actually sitting with: do you know how productive your drivers are?
Not kilometres covered. Not engine runtime. How many stops each driver is completing for every hour they're on duty.
That's Stops Per Driver Hour, and for fleet managers who want real fleet performance data rather than vanity metrics, it's one of the most telling KPIs out there — and almost nobody tracks it.
Let's get into why this deserves a front-row seat on your dashboard, and what improving it actually unlocks.
What Is Stops Per Driver Hour?
It measures exactly what it sounds like: the number of stops — deliveries, pickups, service calls — a driver completes per hour on duty.
Stops Per Driver Hour = Total Stops Completed ÷ Total Driver Hours On Duty
You can pull this daily, weekly, or monthly using telematics, electronic logging devices (ELDs), or fleet management software that captures Hours of Service data alongside delivery records.
Most delivery fleet professionals already have the inputs sitting in their systems. They're just not combining them.
Simple calculation, surprisingly rich findings.
This single number can surface routing inefficiencies, flag excessive dwell times, and expose workload imbalances across your team that nothing else in your fleet data would catch.
Why Traditional Fleet KPIs Miss the Mark
Most fleet management services are built around vehicle-centric data. Miles per gallon, idle time percentage, cost per mile — these all have their place.
But they share a blind spot: they treat the vehicle as the unit of productivity, not the driver.
Two drivers. Same route distance. One completes 15 stops in a shift. The other does 20. If you're only looking at mileage or fuel consumption, those two drivers look identical.
One is 33% more productive than the other — and that gap is completely invisible unless you're tracking Stops Per Driver Hour.
Here's how it compares to the usual metrics fleet owners tend to rely on:
- Deliveries Per Driver Day tracks total daily output but ignores variable shift lengths. A driver doing 30 stops in ten hours looks identical to one doing 30 stops in seven. Stops Per Driver Hour normalises for time — fairer across part-time and full-time drivers alike.
- Average Miles Per Driver measures distance but misses stop density entirely. High mileage between sparse rural stops isn't necessarily more productive than dense urban routes. Stops generate revenue. Kilometres don't.
- Idle Time Percentage tells you the engine is sitting still but doesn't tell you whether the stop sequence makes any sense. Stops Per Driver Hour reveals whether idle time is a symptom of poor route design or slow stop procedures.
- Vehicle Utilisation Rate is completely driver-blind. A fully utilised commercial vehicle with an underperforming driver behind the wheel looks fine on this metric. It isn't.
What Makes This Metric So Powerful?
When you start tracking Stops Per Driver Hour consistently, things surface quickly.
You Spot Your High Performers (and Learn From Them)
If one driver is averaging five stops per hour while the fleet average sits at three, that's not luck.
They're doing something right — tighter route adherence, faster loading and unloading, better time management.
Identifying those patterns lets you build them into driver training and share them across the team.
You Expose Hidden Capacity
This is the big one. Improving your fleet's average from three to four stops per hour is a 33% increase in output. No new hire. No additional fleet vehicle. Just better use of the capacity you already have.
For businesses trying to scale delivery operations without blowing the budget, that kind of efficiency gain is genuinely significant — and it reduces running costs without requiring capital investment.
You Balance Workloads More Effectively
When Stops Per Driver Hour is consistently low across the board, the problem usually isn't the drivers. It's the routing.
Poor planning, traffic delays, stops spread too thin — these drag everyone's numbers down.
Fleet visibility into this metric gives you the evidence to make targeted fixes: dynamic rerouting, smarter stop clustering, better scheduling.
You Connect Productivity to Compliance and Safety
Stops Per Driver Hour ties directly to Hours of Service regulations. Drivers have legally mandated limits, and that's not negotiable.
By measuring productive output inside those windows, fleet management companies and internal fleet teams alike can boost efficiency without pushing drivers into fatigue or compliance risk.
Productivity and driver safety pulling in the same direction, not against each other.
You Reduce Running Costs in Places You Weren't Looking
Fewer low-productivity shifts mean less overtime. More efficient stop sequences mean less fuel consumption on unnecessary loops.
These cost savings don't show up in mileage-focused reports because those metrics are completely blind to time-based inefficiencies.
What Does "Good" Look Like? Setting Your Benchmarks
Benchmarks shift significantly depending on your operating environment:
- Urban delivery fleets typically target 4–6 stops per hour, helped by shorter gaps between stops and higher density.
- Long-haul or regional operations are more realistically looking at 2–3 stops per hour, where greater distances between stops pull the rate down.
Published industry benchmarks for this specific metric are still fairly thin on the ground. The most practical approach is to baseline against your own fleet's historical data.
Track it for a month, find your average, then set incremental targets from there. Even a 10–15% improvement compounds quickly.
If you have 20 drivers each gaining one extra stop per hour across an eight-hour shift, that's 160 additional stops per day across your fleet.
Over a month, you're talking thousands of extra deliveries — without adding a single vehicle or driver to the payroll.
How to Improve Stops Per Driver Hour
Most of the levers here are operational. You don't necessarily need new hardware. Many of these deliver results within weeks.
Audit Your Dwell Times
Dwell time is the minutes a driver spends at each stop. If your average is pushing past 10–15 minutes, there's room to improve.
Dig into what's eating that time — inefficient loading and unloading, customers not being ready, poor stop sequencing.
Shave two minutes off each stop for a driver making 30 per day and you've saved an hour. That adds up fast.
Use Route Optimisation Technology
Compare actual routes driven against planned routes. Deviations add unproductive hours that directly reduce your Stops Per Driver Hour.
Modern fleet management software — some of it now incorporating machine learning to predict traffic and adjust dynamically — can track vehicles in real time and reroute around delays automatically, keeping the fleet on the most efficient path rather than the one that was optimal at 6am.
Invest in Targeted Driver Training
Fleet data can pinpoint specific behaviours that reduce stop rates: hard braking, speeding between stops, inefficient unloading procedures. Use this data for coaching, not punishment.
Drivers who understand why Stops Per Driver Hour matters — and what it means for their own workload — tend to self-correct quickly.
The goal is to gain valuable insights from data points and turn them into better habits.
Integrate Your Tech Stack
Pair your ELDs with GPS and stop-logging tools so that systems are sharing data.
When your management software has full visibility across the fleet — vehicle location, stop completion, hours remaining — you can set alerts for drivers falling below the fleet average in real time.
Same-day interventions rather than end-of-week post-mortems.
Incentivise Without Threatening Safety
Recognising top performers is a cost effective way to promote healthy competition.
Consider acknowledging drivers who consistently hit targets — five or more stops per hour, say — provided safety metrics remain clean. Productivity is the goal. Recklessness is not.
The Hidden Cost of Ignoring This Metric
When you don't track Stops Per Driver Hour, you end up with what some fleet professionals call "ghost capacity."
But output is quietly underperforming, and nothing on your dashboard is flagging it.
This is especially common in fleets that have grown quickly. Add drivers and vehicles fast enough and it's easy to assume more resources automatically means more output.
Without fleet visibility into per-driver productivity, you might be scaling inefficiency right alongside the fleet itself.
Another common trap: conflating Stops Per Driver Hour with deliveries per vehicle.
The vehicle-level view masks individual driver skill gaps entirely, making it nearly impossible to identify who needs support, training, or a better-optimised route.
Fleet owners who only track vehicles lose the ability to quickly respond to performance issues before they compound.
Getting Started Is Easier Than You Think
If you're already using telematics, a driver app, or fleet management software, you almost certainly have the data you need to start. Total stops completed. Total hours on duty. Most modern platforms can generate both without additional hardware.
Pull a month of historical data. Calculate the fleet average and individual driver averages. Look for outliers at both ends — your best and worst performers will tell you more about your fleet operations than any fuel report.
From there, pick a realistic improvement target.
Even modest gains in Stops Per Driver Hour can meaningfully reduce your cost per delivery, free up capacity for growth, and give customers faster, more reliable service.
For businesses trying to keep running costs down while scaling — and that's most of them — that combination is hard to argue with.
Ready to uncover your fleet's hidden capacity? Request access to see how Locate2u can help you track and improve Stops Per Driver Hour.
Frequently Asked Questions
How is Stops Per Driver Hour different from deliveries per day?
Deliveries per day measures raw output without accounting for shift length. Stops Per Driver Hour normalises against time, making it a fairer comparison across drivers working different hours — and a more actionable one for fleet managers trying to track genuine productivity.
What tools do I need to track this metric?
Most fleet management software, telematics platforms, or driver apps that log delivery stops and Hours of Service data will give you the inputs you need. No specialised hardware is typically required.
Can this metric work for service fleets, not just delivery?
Absolutely. Any fleet where drivers are visiting multiple locations in a shift — deliveries, pickups, installations, service calls — can benefit from tracking Stops Per Driver Hour. The formula works the same way.
What's a good target for Stops Per Driver Hour?
Urban delivery fleets typically target 4–6 stops per hour. Regional or long-haul operations are generally looking at 2–3. The best starting point is always your own fleet's historical average — then aim for incremental, sustainable improvement from there.
Related Articles

What Happens to a Delivery Operation When Order Volumes Double Overnight?
One day, everything is running smoothly. Orders are flowing in at a predictable rate, your drivers are covering their routes without drama. Then, seemingly out of nowhere, your order volume doubles...

Why Driver Routing Decisions Still Matter in Automated Fleets
You've invested in route planning software. Your dispatch is automated. The fleet dashboard shows real-time GPS data and perfectly calculated ETAs for every driver, every stop, every address on the list. So why does your most experienced driver keep departing from the suggested route?...
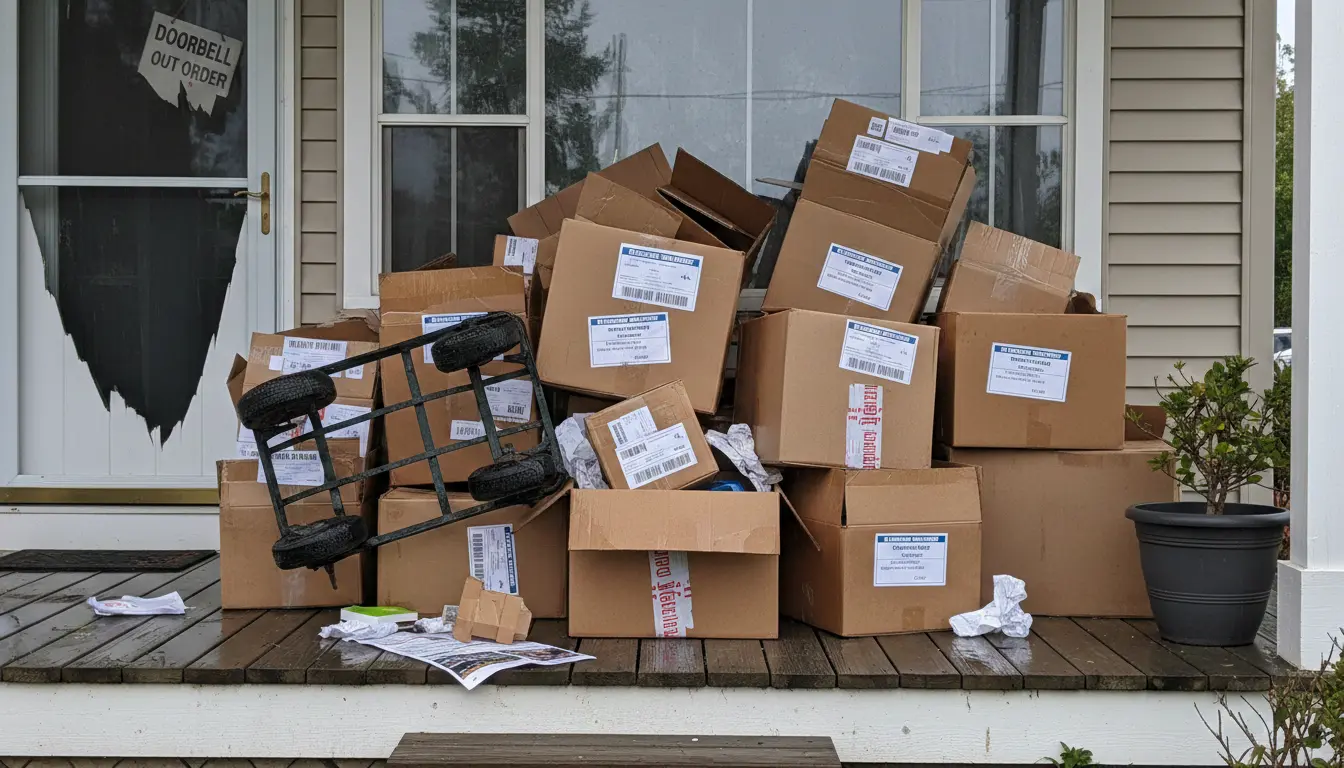
What Actually Causes Failed Deliveries And How Logistics Teams Reduce Them
Failed deliveries are one of those problems that can feel impossible to pin down because the causes are scattered across the entire supply chain. But here's the thing: most of them are preventable...